Foot traffic analytics isn’t about counting visitors; it’s about engineering a retail experience that strategically doubles your conversion rate.
- Minor improvements, like a 10-second increase in customer dwell time, can create major sales uplifts.
- Seamless ‘phygital’ experiences and zero-friction checkouts are no longer optional—they’re essential for modern retail survival.
Recommendation: Stop merely analyzing traffic and start using it to make strategic decisions on everything from your store layout to your long-term real estate portfolio.
In the relentless battle against e-commerce giants, physical retail spaces often feel like they’re on the defensive. Store owners and mall managers watch footfalls with anxiety, hoping that enough visitors will translate into sales to keep the lights on. The conventional wisdom has been to focus on broad strokes: adjust staffing for peak hours, rearrange a few displays, and hope for the best. This approach, however, treats foot traffic as a simple report card—a passive metric of success or failure.
But what if this data wasn’t just a reflection of the past, but a blueprint for the future? What if, instead of just counting people, you could start engineering their behavior? The true power of foot traffic analytics lies in moving beyond basic counts to a deep understanding of customer movement, hesitation, and interaction. It’s about conducting ‘friction audits’ to find the small, almost invisible barriers that kill conversions and mastering ‘phygital fluidity’ to create a seamless journey from the digital world to your physical aisles.
The key isn’t just to get more people in the door; it’s to strategically increase the value of every single visit. This guide reframes foot traffic data as a powerful strategic asset. We will explore how to translate abstract numbers into concrete actions that boost sales, from micro-optimizations on the shop floor to macro-decisions that define the long-term value of your commercial property. It’s time to stop reacting to data and start designing with it.
To navigate this new landscape, we’ve structured this guide to move from in-store tactics to broad-level strategy. This playbook will equip you with the insights needed to transform your physical space into a high-performance conversion engine.
Summary: Your Playbook for Data-Driven Retail Conversion
- Why Increasing Customer “Dwell Time” by 10 Minutes Boosts Sales by 30%?
- How to Merge Digital Catalogs with Physical Showrooms Without Confusing Shoppers?
- Pop-Up Store vs Long-Term Lease: Which Strategy Is Safer for New Brands?
- The Connectivity Mistake That Drives 40% of Gen Z Shoppers Out of Your Store
- How to Redesign the Checkout Zone to Process Queues 2x Faster?
- Why Does a 1-Second Delay Cost You 7% in Conversions?
- Warehouses vs Strip Malls: Which Asset Class Survives a Recession Better?
- How to Identify Undervalued Commercial Properties Before the Market Rebounds?
Why Increasing Customer “Dwell Time” by 10 Minutes Boosts Sales by 30%?
In retail, time is literally money. “Dwell time”—the total duration a customer spends in your store—is one of the most powerful predictors of conversion. It’s a common misconception to focus solely on getting more customers through the door. The real opportunity lies in encouraging the customers you already have to stay longer. A longer visit indicates deeper engagement, more product discovery, and a higher probability of making a purchase. The correlation is so strong that even marginal gains can produce exponential results. In fact, research from Retail Sensing reveals that a tiny 10-second increase in dwell time can lead to a staggering 130% boost in sales for certain product categories.
This isn’t just a theoretical concept; it’s a strategy executed to perfection by leading retailers. Consider the warehouse club model. Costco has mastered the art of maximizing dwell time. Their stores are designed for exploration, with product sampling stations, a constantly changing inventory, and bulk-sized deals that require thoughtful consideration. The result? In the first half of 2024, Costco visitors spent an average of 37.3 minutes in-store, significantly more than at Walmart (31.8 minutes) or Target (28.7 minutes). This extended engagement translates directly into fuller carts and higher average transaction values.
So how do you engineer a longer dwell time? It starts with analyzing your foot traffic patterns to identify “dead zones” and “hot spots.” Use this data to strategically place high-interest products, create comfortable seating areas, or introduce interactive displays. Offering in-store events, workshops, or even a small café can transform a purely transactional space into an experiential destination. The goal is to eliminate “friction” and add “attraction,” making your store a place where customers want to spend their time, not just their money.
How to Merge Digital Catalogs with Physical Showrooms Without Confusing Shoppers?
Today’s customer journey is no longer linear; it’s a fluid dance between online research and in-person experience. This is the era of “phygital fluidity,” where the line between the digital and physical worlds blurs. The challenge for retailers is to integrate digital tools like online catalogs, interactive kiosks, and mobile apps into the physical showroom without creating a clunky, confusing experience. When done right, this integration empowers customers and assists sales. When done wrong, it creates friction and drives them away.
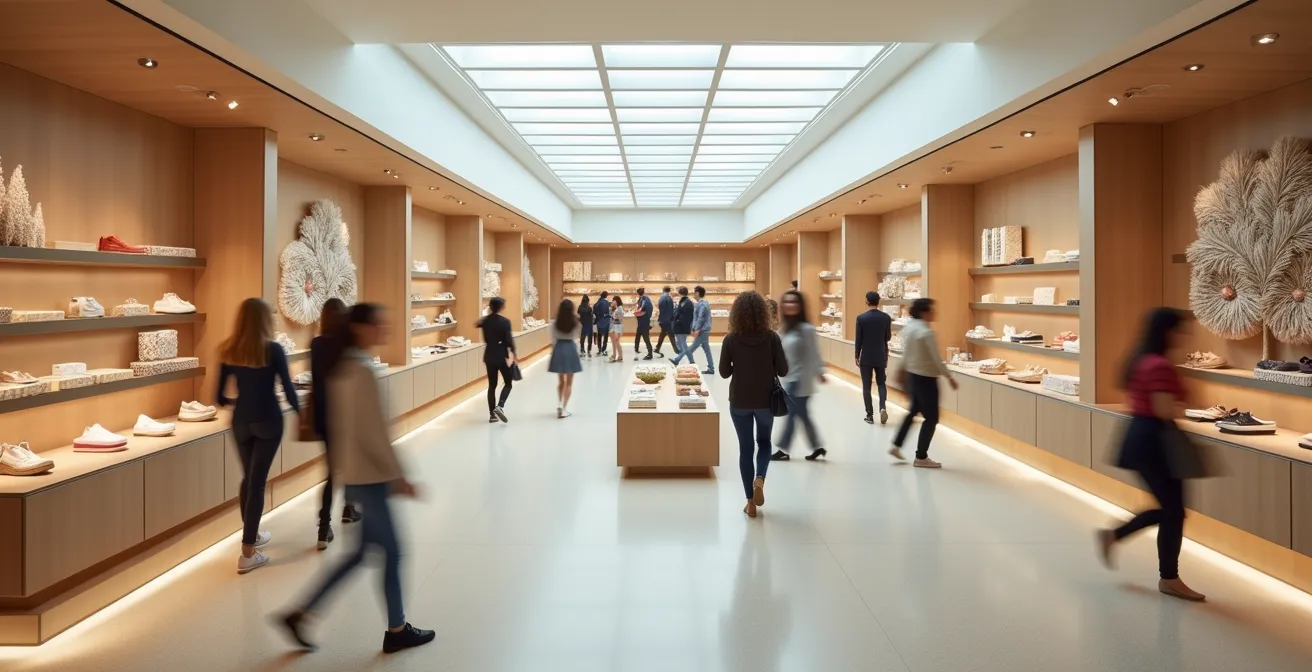
A successful phygital strategy hinges on seamlessness. The goal is for digital tools to enhance the physical experience, not replace it. This could mean using QR codes on products that link to online reviews, digital displays showing “trending in this store” items based on real-time traffic, or tablets that allow associates to check inventory for an out-of-stock item and order it for home delivery on the spot. It’s about giving customers the information they crave, exactly when and where they need it.

As the image above illustrates, the ideal scenario is a harmonious blend where technology supports human interaction. Success here depends on a few key principles. First, integrate your data streams. Your foot traffic analytics should connect with your Point of Sale (POS) system to track “digital-assist” conversions. Second, train your staff to see digital tools as engagement triggers, not threats. An alert that a customer has spent three minutes on a kiosk is an invitation for an associate to offer help. Finally, measure what matters. Forget traditional sales per square foot and start tracking metrics like the “digital-assist conversion rate” to understand the true ROI of your phygital investments.
Pop-Up Store vs Long-Term Lease: Which Strategy Is Safer for New Brands?
For a new brand, entering the world of physical retail can feel like a high-stakes gamble. The traditional long-term lease, with its multi-year commitment and significant upfront investment, can be daunting. This is where foot traffic analytics provides a powerful de-risking tool, especially when deciding between a temporary pop-up and a permanent store. The choice is no longer based on gut feeling but on a calculated, data-driven strategy. A physical presence has a measurable impact on digital success; according to ICSC’s latest halo effect report, opening a new store drives an average 6.9% boost in a brand’s online sales in that market.
The pop-up store is the ultimate data acquisition tool. It’s a real-world laboratory to test a location, validate assumptions about your target demographic, and measure purchase intent before committing to a costly lease. Foot traffic data gathered during a one-to-three-month pop-up provides invaluable “asset intelligence.” You can analyze visitor demographics, dwell times, and conversion rates to build a bulletproof business case for a long-term location. This data becomes your primary leverage when negotiating lease terms with a landlord.
The following table breaks down how to frame the decision, not as a choice between temporary and permanent, but as a strategic progression from data collection to sustained revenue generation. By analyzing data from potential locations before even signing a pop-up agreement, brands can make smarter, safer decisions.
| Metric | Pop-Up Store | Long-Term Lease |
|---|---|---|
| Primary Goal | Data acquisition & market validation | Sustained revenue generation |
| Key Success Metric | New Customer Acquisition Cost | Monthly sales per square foot |
| Risk Level | Low (1-3 month commitment) | High (3-10 year commitment) |
| Data Collection Value | High – validates demographics & location | Moderate – ongoing optimization |
| Negotiation Leverage | Builds data for future negotiations | Limited without prior location data |
Ultimately, a pop-up isn’t just a short-term sales event; it’s a strategic investment in market intelligence. The foot traffic data you collect provides the confidence and negotiating power needed to transition to a successful and profitable long-term lease. You can even use external analytics, like those discussed in a comparative analysis of foot traffic data, to pre-screen potential pop-up locations.
The Connectivity Mistake That Drives 40% of Gen Z Shoppers Out of Your Store
In today’s retail environment, a customer’s smartphone is an extension of their shopping experience. They use it to compare prices, read reviews, consult friends, and look for inspiration. In fact, research shows that more than 25% of American consumers used a smartphone during their last in-store shopping trip. For Gen Z, this figure is significantly higher. The critical mistake many retailers make is treating in-store Wi-Fi as a basic utility, like plumbing or electricity. Unreliable, slow, or non-existent connectivity is a major point of friction that can cause digitally native shoppers to abandon their visit entirely.
Poor connectivity isn’t just an inconvenience; it’s a conversion killer. Imagine a customer trying to load a product review video, only to be met with a buffering wheel. Or a shopper wanting to share a photo of an outfit with a friend, but the message won’t send. These small moments of frustration break the shopping flow and create a negative perception of your brand. For a generation accustomed to instant digital access, a lack of reliable Wi-Fi can feel like a closed door.
Smart retailers, however, are transforming Wi-Fi from a simple utility into a powerful engagement and data-collection tool. By offering free, high-speed Wi-Fi, you not only eliminate a key friction point but also open a new channel for interaction. This is where you can perform a true ‘Friction Audit’ and turn a negative into a positive. Here’s how to convert your Wi-Fi into a strategic asset:
- Create Engaging Landing Pages: Use your Wi-Fi captive portal not just for login, but to offer exclusive in-store content, access to a virtual stylist, or a gamified shopping experience.
- Bridge Physical and Digital Profiles: Wi-Fi login data (with user consent) can help you connect an anonymous in-store visitor to their known digital profile, enabling powerful omnichannel retargeting.
- Automate Marketing Triggers: Deploy automated campaigns based on Wi-Fi connection patterns. For example, a customer who dwells in the shoe department for 10 minutes could receive a targeted offer for footwear.
How to Redesign the Checkout Zone to Process Queues 2x Faster?
The checkout zone is the final, and most critical, hurdle in the customer journey. It’s the last impression you make, and a poor experience can undo all the great work you’ve done elsewhere in the store. Long queues are a primary source of customer frustration and abandoned carts. In fact, consumer research indicates that retail customers are prepared to wait in checkout lines for a maximum of five to ten minutes before their satisfaction plummets. The goal is to maximize “conversion velocity”—the speed and efficiency with which a customer can complete their purchase.
Redesigning the checkout is not just about adding more cashiers. It requires a strategic approach informed by foot traffic data. Analyzing queue length patterns, wait times, and peak transaction periods allows you to move from a reactive to a predictive model. Why wait for a long line to form before opening a new register? Technology now allows for a much smarter approach.

The most innovative retailers are creating a ‘zero-queue perception’ through intelligent design and technology. This involves a multi-pronged strategy: implementing mobile POS (mPOS) systems that allow associates to check out customers anywhere on the floor, offering self-checkout kiosks, and using a single-line “serpentine” queue that feeds into multiple registers, which is psychologically proven to feel faster. The most advanced solutions even use AI to predict queue formation before it happens.
Case Study: AI-Powered Predictive Queue Management
Leading retailers are now implementing AI-driven systems that analyze historical foot traffic and real-time visitor counts to forecast queue formation 15-30 minutes in advance. By combining this data with average transaction times, these systems can preemptively alert staff to open additional registers or deploy associates with mobile POS units before a queue even becomes visible to customers. This proactive approach creates a seamless, zero-friction checkout experience that significantly boosts customer satisfaction scores and reduces the likelihood of abandoned sales.
Why Does a 1-Second Delay Cost You 7% in Conversions?
In the world of e-commerce, the “1-second delay” rule is legendary: a mere one-second lag in page load time can cause a 7% drop in conversions. As a physical retailer, it’s tempting to dismiss this as a purely digital problem. This is a critical mistake. The psychological principle behind this statistic—that unexpected friction creates frustration and abandonment—is universal. In a physical store, these delays manifest differently, but their impact is just as severe. A healthy conversion rate in retail environments can range from 20-40%, and every point of friction erodes that potential.
A one-second web delay is the digital equivalent of an in-store “friction event.” These are the small, frustrating moments that disrupt a customer’s shopping flow: a blocked aisle forcing a detour, a confusing sign that requires a moment of deciphering, an unavailable sales associate, or a product that’s just out of reach. Each of these micro-delays adds up, increasing cognitive load and decreasing purchase intent. Foot traffic analytics, particularly heatmap and pathing analysis, is the tool you use to conduct a ‘Friction Audit’ and identify these conversion killers.
A retail analytics expert from Shopify powerfully connects these two worlds in their guide on foot traffic:
A 1-second web delay is equivalent to a 10-second ‘friction event’ in-store – a blocked aisle, a confusing sign, an unavailable associate.
– Retail Analytics Expert, Foot Traffic: How To Measure and Increase Store Visits
This quote crystallizes the issue. Your store’s layout, signage, and staffing are all part of your “user interface.” By analyzing where customers slow down, turn back, or bypass entire sections, you can pinpoint these friction events. The solution might be as simple as widening an aisle, clarifying a promotional sign, or repositioning staff to high-traffic zones. Eliminating these small moments of hesitation is one of the most effective ways to protect your conversion rate and improve the overall shopping experience.
Warehouses vs Strip Malls: Which Asset Class Survives a Recession Better?
When economic uncertainty looms, not all commercial properties are created equal. The resilience of a retail asset during a recession is directly tied to its ability to offer more than just a place to buy things. Foot traffic analytics provides the “asset intelligence” needed to look beyond rent rolls and assess a property’s true defensive value. The data reveals a clear winner in economic downturns: mixed-use properties that blend retail with dining and leisure consistently outperform single-purpose centers like traditional strip malls or warehouse-style power centers.
The reason lies in the shift in consumer spending during a recession. While spending on goods becomes more discretionary, spending on experiences and social connection remains relatively stable. Properties that function as community hubs, offering a place to eat, socialize, and be entertained, maintain their visitor traffic and, by extension, support their retail tenants. Global studies have shown that properties offering this kind of experiential retail see significantly longer visitor dwell times and higher sales than their purely transactional counterparts.
Case Study: The Resilience of Mixed-Use Properties
Analysis of major global properties, including transit hubs in Moscow, demonstrates that mixed-use developments combining retail, dining, and leisure maintain longer visitor dwell times and weather economic downturns more effectively. During periods of financial pressure, these properties see up to 40% longer visits and 30% higher sales than traditional retail-only setups, as consumers prioritize spending on experiences. This provides a crucial buffer for retail tenants located within these resilient ecosystems.
For mall managers and property investors, foot traffic data is the key to quantifying this resilience. It allows you to move beyond anecdotal evidence and measure the synergistic value of your tenant mix. By analyzing cross-visitation patterns—tracking how many visitors frequent multiple stores, restaurants, and entertainment venues in a single trip—you can calculate a property’s “Experience Elasticity Index.” This metric scores its value as a social destination versus a simple utility, providing a powerful indicator of its ability to withstand economic headwinds.
Your Action Plan: Assessing a Property’s Recession Resilience
- Calculate the ‘Experience Elasticity Index’: Use foot traffic data to measure average dwell time, cross-shopping behavior between tenants, and visit frequency. Score properties on their social/discovery value versus their pure utility function.
- Analyze Tenant Synergy: Identify properties where visitors frequent three or more stores per visit. These multi-destination centers show far stronger resilience than those where visitors make a single stop.
- Profile Visitor Demographics: Assess the income stability of a property’s customer base. Properties that attract a loyal, more affluent demographic are better positioned to withstand recessions than those dependent on price-sensitive shoppers.
Key Takeaways
- Dwell Time is a Direct Lever for Sales: Small increases in the time customers spend in your store have an outsized, positive impact on conversion rates and average transaction value.
- Friction is the Conversion Killer: Whether it’s a slow website or a blocked aisle, every moment of friction—digital or physical—reduces customer satisfaction and erodes potential sales.
- Store-Level Data Informs Portfolio-Level Strategy: Insights gathered on the shop floor (like dwell time and traffic patterns) are critical for making macro-level real estate decisions, from lease negotiations to recession-proofing your asset portfolio.
How to Identify Undervalued Commercial Properties Before the Market Rebounds?
In the cyclical world of commercial real estate, the greatest opportunities are often found just before the market turns a corner. Identifying an undervalued property before it’s on everyone’s radar requires looking at leading indicators, not lagging ones. Traditional metrics like vacancy rates and rental income show where the market *has been*. Foot traffic analytics, however, shows where the market *is going*. A subtle but sustained increase in visitor traffic to a specific area or property type is often the first sign of a recovery.
While broad market data might show slow growth, such as the 0.4% year-over-year foot traffic growth seen in the retail sector in early 2024, granular data can tell a much different story. An investor armed with this ‘asset intelligence’ can spot a neighborhood or a specific strip mall that is outperforming the market average by several percentage points. This localized uptick in foot traffic is a powerful signal of burgeoning consumer demand and future rental growth potential. It allows you to invest based on predictive data, not reactive sentiment.
The key is to connect the micro-trends we’ve discussed—like dwell time, visitor demographics, and cross-visitation patterns—to macro-level investment decisions. An undervalued property might not just be one with low rent, but one with a ‘stickier’ customer base (longer dwell times), a resilient demographic profile, and strong tenant synergy that isn’t yet reflected in its price. By analyzing foot traffic data, you can build a forward-looking valuation model that identifies properties poised for growth before the rest of the market catches on. This is how you move from being a price-taker to a value-creator in the commercial real estate landscape.
The data is waiting. The tools are available. The retailers and property managers who thrive in the coming years will be those who stop seeing foot traffic as a number and start treating it as a strategic language. It’s time to transform this data from a simple metric into your most powerful asset to engineer a profitable, resilient, and customer-centric future for your physical space.